


Maestro’s Graphs make Energy Management so easy like never before!
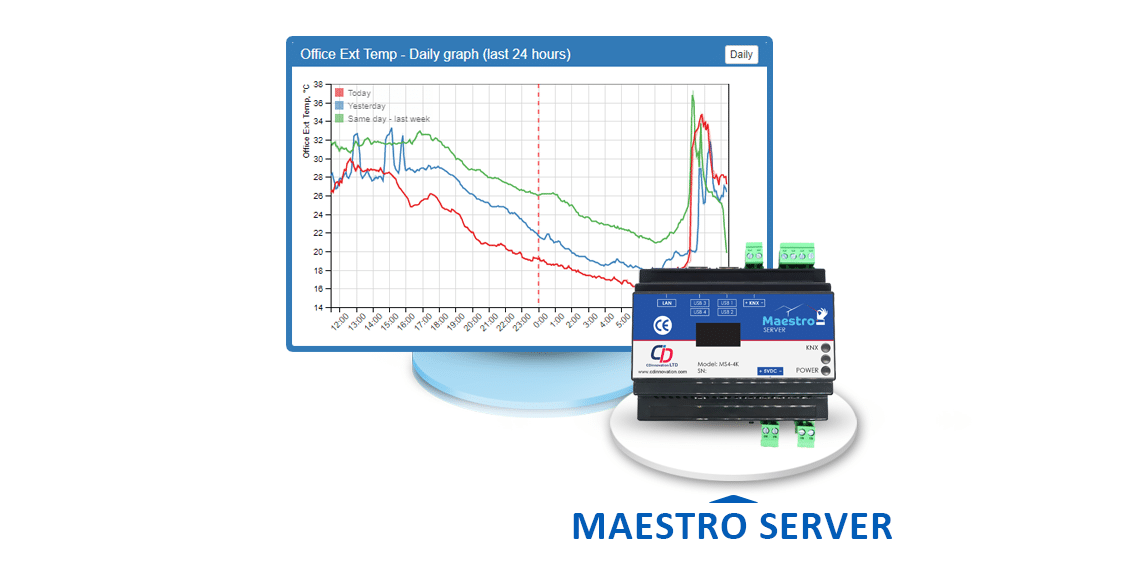
CD Innovation is happy to announce of some new characteristics lately added and supported by Maestro. It is now capable of collecting various data such as temperature, wind speed, power consumption, solar radiation etc’ and presenting them on graphs. The source of such data can be received directly from equipment connected to Maestro using communication means such as: MQTT, MODBUS and KNX or the result of internal calculations performed by Maestro such as the schematic of various loads, calculation of electricity costs, water throughputs, etc’.
Independent of communication, cloud and payment services, Maestro locally collects and stores the required data. It can store tens of millions of samplings enabling to collect history data from up to 1000 different sources for up to 3 years each.
Minimal work for the integrator – ticking only a checkbox and the rest is automatically done.
Maximum flexibility for the end user – Data can be presented, monitored and analyzed by the end-user for maximum optimization, using various graph types: daily, weekly, monthly and annually. Comparative graphs may be used as well. e.g. electricity consumption this month as compared to the previous month or to the same month last year. The user can also export all data along any period of time as CSV file type utilizing for instance, Maestro as a KNX data logger, to process and present the logged data by other platforms regardless of what can be presented by Maestro.
Adding such new functions as energy management and data analyzing puts Maestro KNX Server at the forefront technology. CD Innovation has been constantly tuned to the market rapidly growing needs enhancing Maestro with new features and improvements providing its customers everywhere with uncompromising quality at most competitive cost.